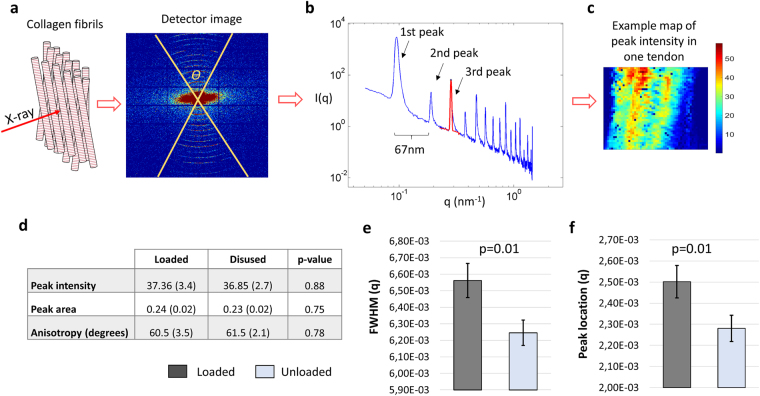
Figure 3.
SAXS: A region in the middle of the intact tendons was radiated with X-rays. The resulting X-ray diffraction pattern (detector image) contains information on the collagen organization. The diffraction pattern of tendon collagen was typically concentric arcs from which the tissue structure was computed (a). Angular integration of each diffraction pattern, in the interval denoted Ɵ, generated an intensity curve versus q where the spikes are the collagen peaks arising from the D-periodicity of the molecule (b). By analyzing the 3rd collagen peak for each data point from the measured region, spatial information about the tissue organization could be calculated (c, example of spatial map). It was found that unloading led to more fibrillar adhesion (d,e) Full Width Half Maximum - FWHM), but no major change in fibril organization. Furthermore, the peak location q (=2π/D-period) was slightly lower in unloaded tendons (f). This illustrates larger D-spacing compared to loaded tendons. A mixed effect model with likelihood ratio test was used to distinguish statistical difference between the loaded and unloaded tendons, where the bar plots display the estimated averages and standard errors (n = 10 in both groups).

