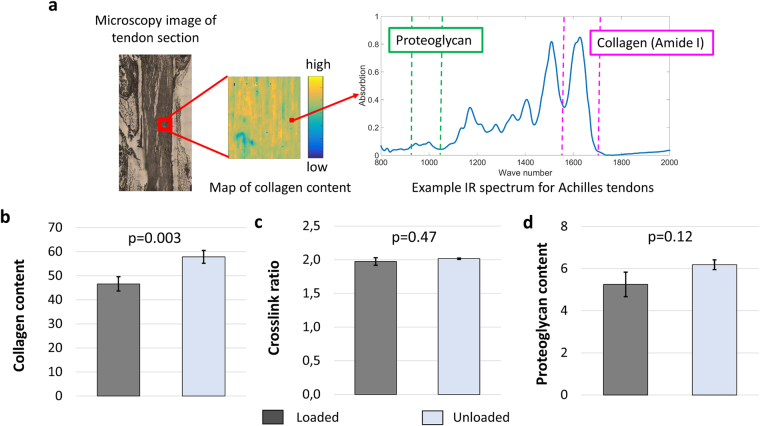
Figure 4.
A region of the mid-tendon section is selected using a light microscope and measured with IR spectroscope that creates a spatial map of the molecular content in that region. Each of measurement point is associated with an absorption spectrum from which collagen and proteoglycan contents are estimated (a). Collagen content (absorption of peak 1720–1585 cm−1), estimated as the stretching vibrations of the C=O amide bond, increased in response to unloading (b). Unloading did not affect cross-link ratio (ratio of peaks at 1660/1690 cm−1) (c) and resulted in a slight but not significant increase in proteoglycan content (absorption of peak 1125–970 cm−1) (d). Absorption units are arbitrary. A mixed effect model in combination with a likelihood ratio test was used to distinguish statistical difference between the loaded and unloaded tendons, where the bar plots displays the estimated averages and standard errors (n = 10 in both groups).

