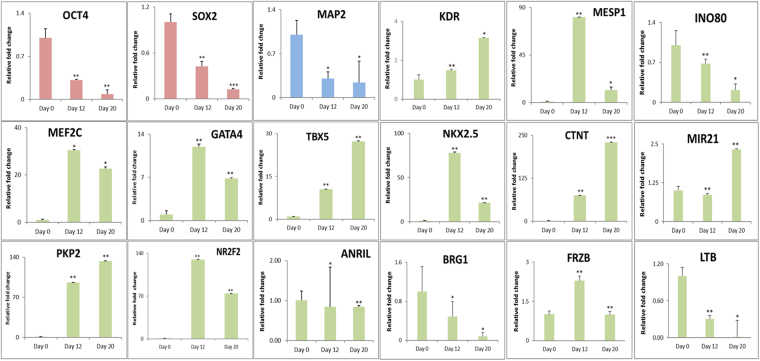
Figure 5.
Validation of Microarray data by qRTPCR. qRT-PCR validation for the crucial genes like OCT4, SOX2 (pluripotency) (red), MAP2 (ectodermal) (blue), KDR2, MESP1, MEF2C, GATA4, TBX5, NKX2.5, CTNT, PKP2, FRZB (mesodermal- cardiac), LTB, INO80, BRG1, MIR21 and ANRIL (epigenetic machinery) (green) in the D0, D12 and D20 cells profiled by microarray. Error bars represent ± SEM, statistical significance represented as *(P < 0.5), **(P < 0.01), ***(P < 0.001).

