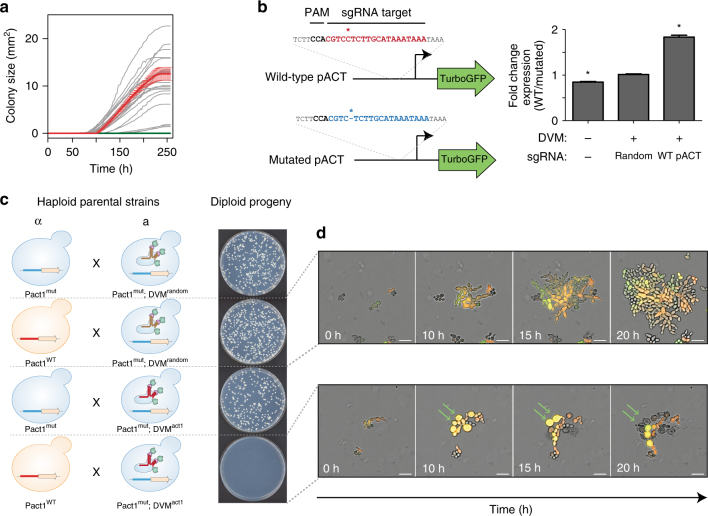
Fig. 2.
Engineering speciation by synthetic incompatibility. a Growth curves of yeast expressing DVM targeted to promoter regions of SI candidate genes. Random sgRNA control shown in red. Best ACT1 targeting sgRNA in green. All others in gray. (n = 2 transformations, mean ± SEM, error bars omitted for gray lines for clarity). b (Left) Diagram of mutated and wild-type ACT1 promoter-GFP constructs. (Right) GFP expression ratios with or without DVM and/or ACT1 promoter specific sgRNA. (*p < 0.05, one-way ANOVA followed by Tukey’s post-test, n = 3 independent cultures, mean ± SEM). c (Left) Schematic representation of SI components present in haploid strain crosses and (right) the resulting diploid colonies. Results representative of three independent replicates. d Live-cell imaging time lapse of diploid cells from crossing RFP+ MATα with GFP+ Mata cells in a compatible (Top) and incompatible (Bottom) mating. Green arrows indicate cells which swell and lyse. The experiment was repeated twice. 20 µm scale bar

