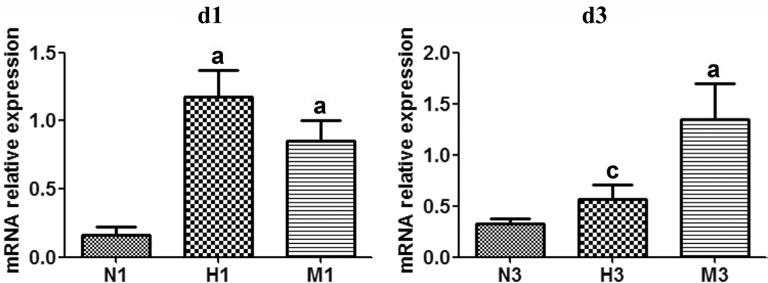
Figure 4. HRS-induced effects on Iba1 mRNA expression in MNU-treated retinas.
qRT-PCR analysis of Iba1 mRNA expression at d1 and d3 after MNU administration. Compared to N group, the expression of Iba1 mRNA in M group was increased at d1 and d3 after MNU administration. However, in H group, Iba1 mRNA expression level at d1 was somewhat higher than that of M group, while lower than that of M group at d3. n=3. aP<0.05 vs N group; cP<0.05 vs M group.

