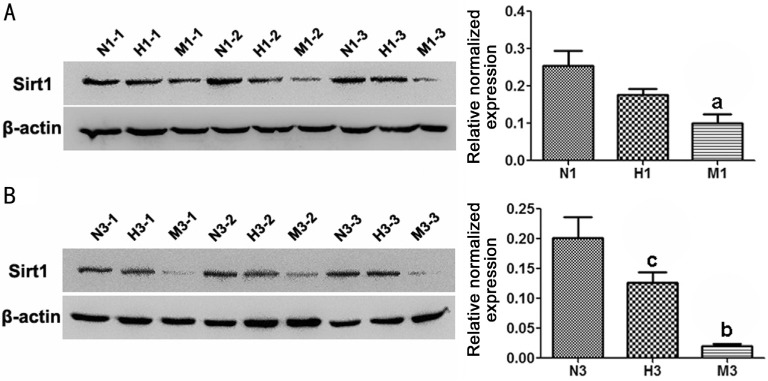
Figure 6. HRS-induced effects on Sirt1 protein expression in MNU-treated retinas.
Representative Western blot bands and quantitative analysis of Sirt1 protein expression at d1 (A) and d3 (B) after MNU administration. Compared to N group, the protein expression of Sirt1 in M group was substantially reduced at d1 and d3 after MNU administration. However, Sirt1 protein level in H group was higher than that in M group. n=3; N (H, M) 1 (3)-1 (2, 3): three different rats at d1 or d3 of each group; aP<0.05, bP<0.01 vs N group; cP<0.05 vs M group.

