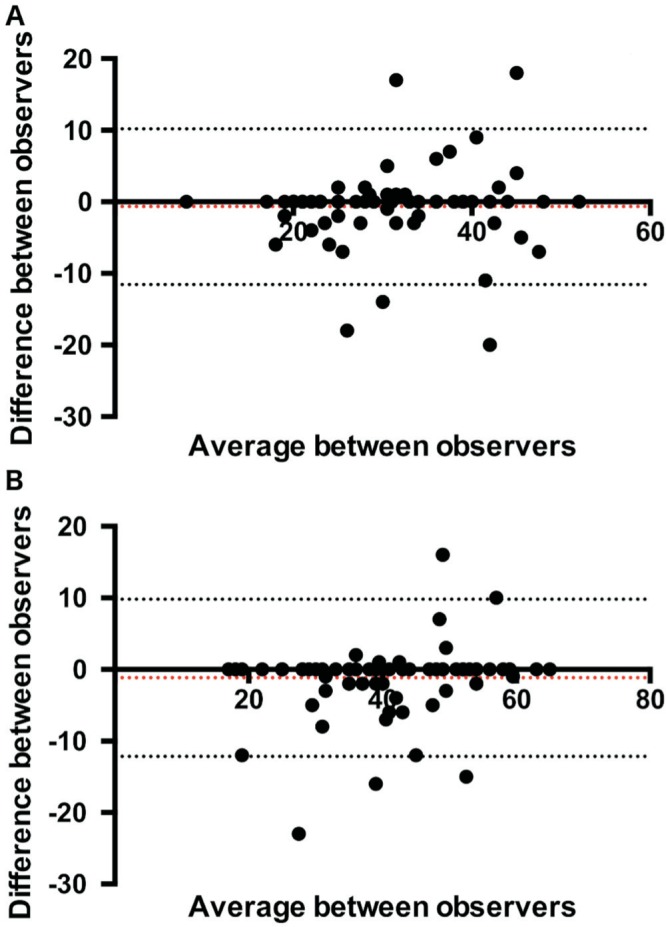
Figure 3. Bland-Altman plot of difference in superficial vessel density [panel A; mean difference -0.68 (95% limits of agreement -11.57; 10.20)] deep vessel density [panel B; mean difference -1.16 (95% limits of agreement -12.15; 9.8)] measurements between observers against their mean.

