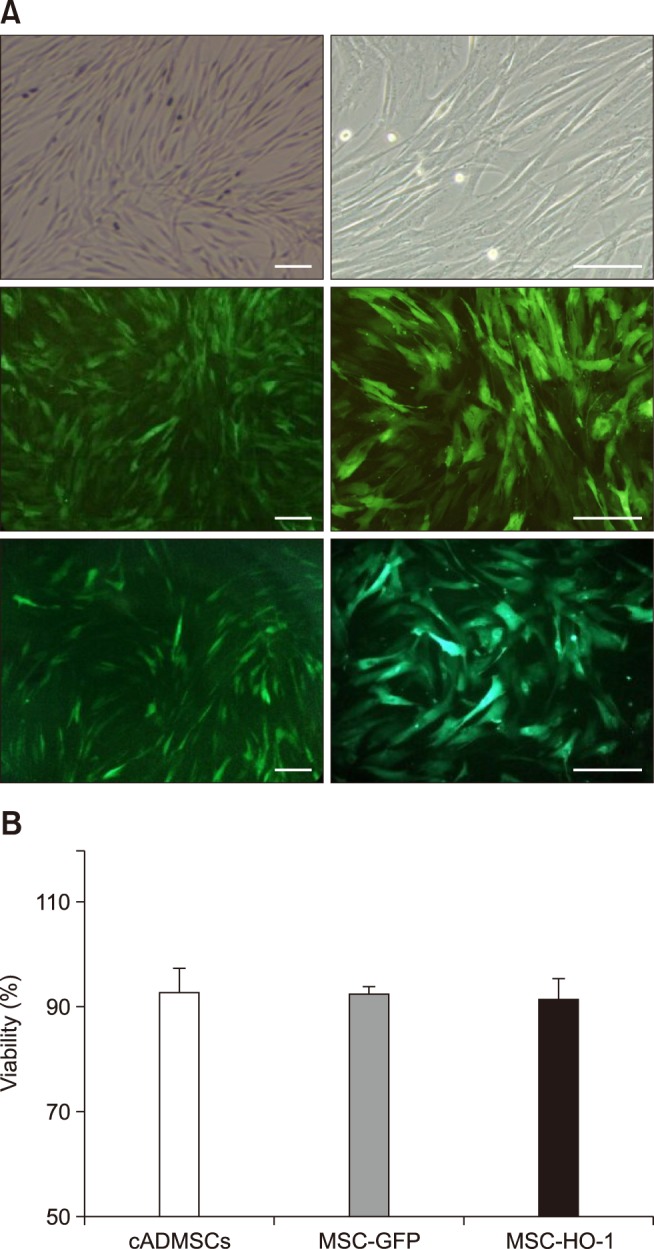
Fig. 1. Fluorescence microscopy images and cell viability results. (A) Green fluorescence protein (GFP) overexpressing cADMSCs. Top panels, cADMSC; middle panels, GFP-labeled cADMSCs (MSC-GFP); lower panels, GFP-labeled HO-1 overexpressing cADMSCs (MSC-HO-1). GFP expression was identified in MSC-GFP and MSC-HO-1 via fluorescence microscopy. Right panels are higher magnification images of left panels, respectively. (B) Cell viability of the three cell types showing no significant difference. Scale bars = 50 µm.

