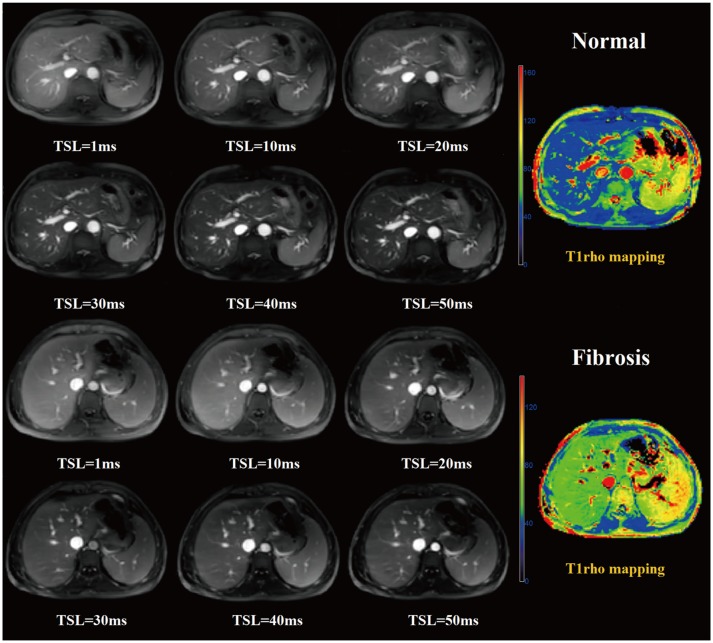
Fig. 2. Examples of healthy subject and fibrosis patient T1rho-weighted images and T1rho map.
Upper (row 1 and 2) and lower (row 3 and 4) two rows show liver T1rho-weighted images acquired with times of spin lock pulse (TSL) of 1–50 ms, and T1rho map in 61-year-old normal control subject and 21-year-old patient with fibrosis. Fibrosis liver tissue demonstrates higher signal intensity in T1rho-weighted images and T1rho values in T1rho map, than normal liver tissue.

