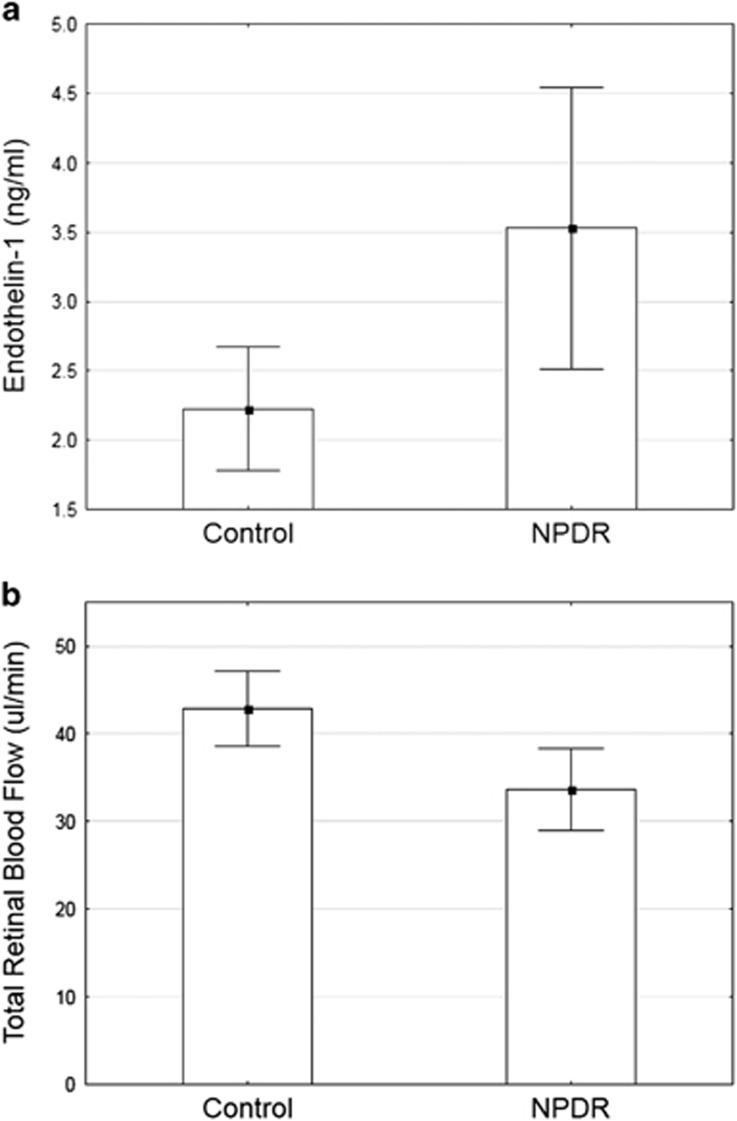
Figure 1.
Plots of means (a) aqueous ET-1 as a function of group. ET-1 is significantly elevated in the NPDR group compared with the controls, P=0.02. (b) TRBF as a function of group. TRBF was significantly reduced in the NPDR group compared with the controls, P=0.002. Error bars indicate 95% confidence intervals of the mean. NPDR, non-proliferative diabetic retinopathy.

