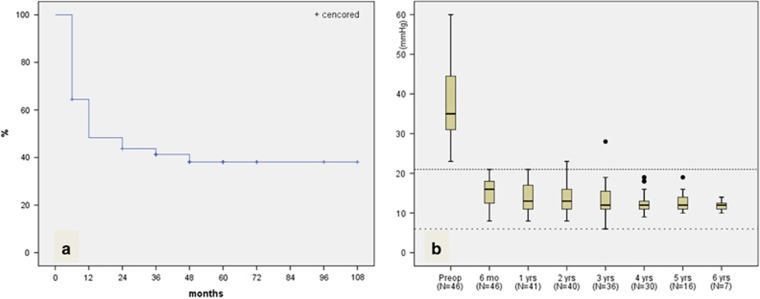
Figure 1.
Percent survival patients without a complication after Ahmed glaucoma valve implantation (a). Box-plot representation of IOP values over 6 years of follow-up (b): Median values (dark lines), 25/75 (boxes), and 5/95 percentiles (bars), and outliers (circles), respectively. Follow-up periods and number of cases in each period are shown on the abscissa. Upper dashed line represents 21 mm Hg and lower dashed line represents 6 mm Hg.

