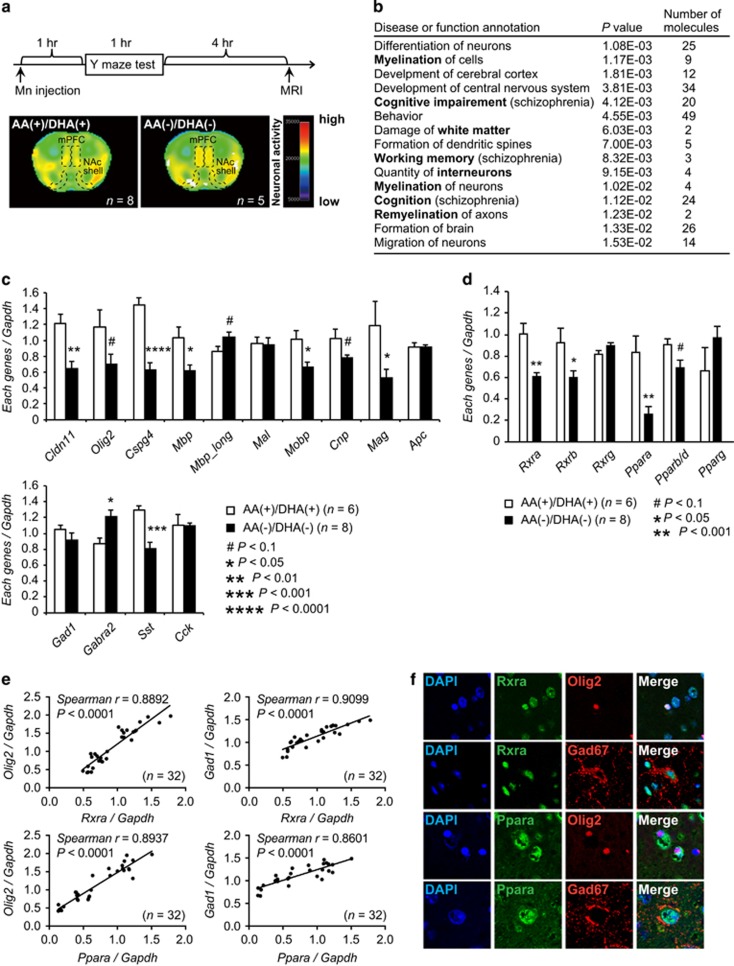
Figure 2.
Macroscopic neuronal imaging and gene-expression analyses in the AA(+)/DHA(+) and AA(−)/DHA(−) groups. (a) Upper panel: time schedule for the manganese (Mn)-enhanced magnetic resonance imaging (MRI) analysis. MRI signals were obtained at 4 h after the Y-maze test (at 6 h after intraperitoneal injection of MnCl2). Lower panel: the intensity of the Mn-enhanced MRI signal in the medial prefrontal cortexes (mPFC) and the nucleus accumbens (NAc) shell of an AA(−)/DHA(−) mouse was substantially greater than that of an AA(+)/DHA(+) mouse. (b) The differentially expressed genes were primarily enriched in ‘disease and bio functions’ (Ingenuity Pathway Analysis (IPA)). (c) Quantitative real-time (RT)-PCR analysis of oligodendrocyte cell-related genes (upper panel) and GABAergic neuron-related genes (lower panel). Values are means±s.e. Gapdh was used as an internal control. P-values were calculated using unpaired t-tests. #P<0.1, *P<0.05, **P<0.01, ***P<0.001. (d) Quantitative RT-PCR analysis of nuclear receptor genes. Values are means±s.e. Gapdh was used as an internal control. P-values were calculated using unpaired t-tests. #P<0.1, *P<0.05, **P<0.01. (e) Correlation analyses between relative Rxra or Ppara levels and Olig2 or Gad1 levels. Data were evaluated using Spearman’s rank-correlation tests. (f) Immunohistological analyses. Rxra and Ppara were expressed in the Olig2-positive and Gad67-positive cells.

