Figure 3.
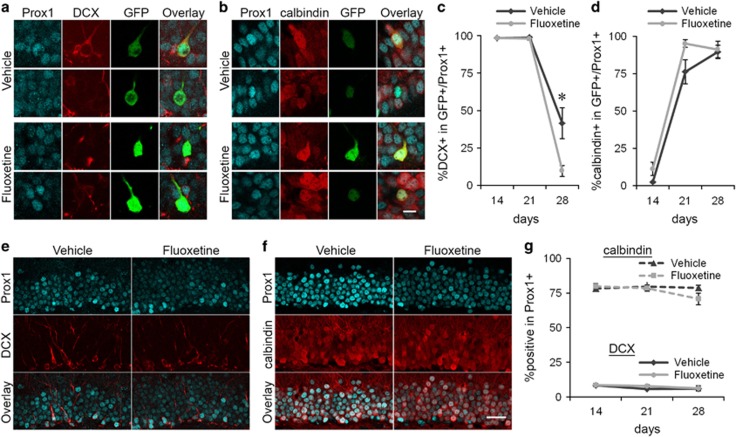
Fluoxetine treatment shifts maturational changes in the expression of DCX and calbindin in new neurons. The experimental time line is described in Figure 1a. (a) Representative images of two GFP+/Prox1+ cells each from the vehicle- and fluoxetine-treated mice on day 28. One of them expresses DCX. Red: DCX, Cyan: Prox1, Green: GFP. (b) Representative images of two GFP+/Prox1+ cells each from the vehicle- and fluoxetine-treated mice on day 28. Three of them express calbindin. Red: calbindin, Cyan: Prox1, Green: GFP. (c, d) Percentages of DCX+ cells in GFP+/Prox1+ cells (c) and calbindin+ cells in GFP+/Prox1+ cells (d) on days 14, 21, and 28. *P<0.05, Mann–Whitney U test with Bonaferroni correction. (e) Representative images of the granule cell layer from vehicle- and fluoxetine-treated mice. Red: DCX, Cyan: Prox1. (f) Representative images of the granule cell layer from the vehicle- and fluoxetine-treated mice. Red: calbindin, Cyan: Prox1. (g) Percentage of DCX+ cells and calbindin+ cells in Prox1+ cells on days 14, 21 and 28. Scale bars, 10 μm (a and b), 30 μm (e and f).

