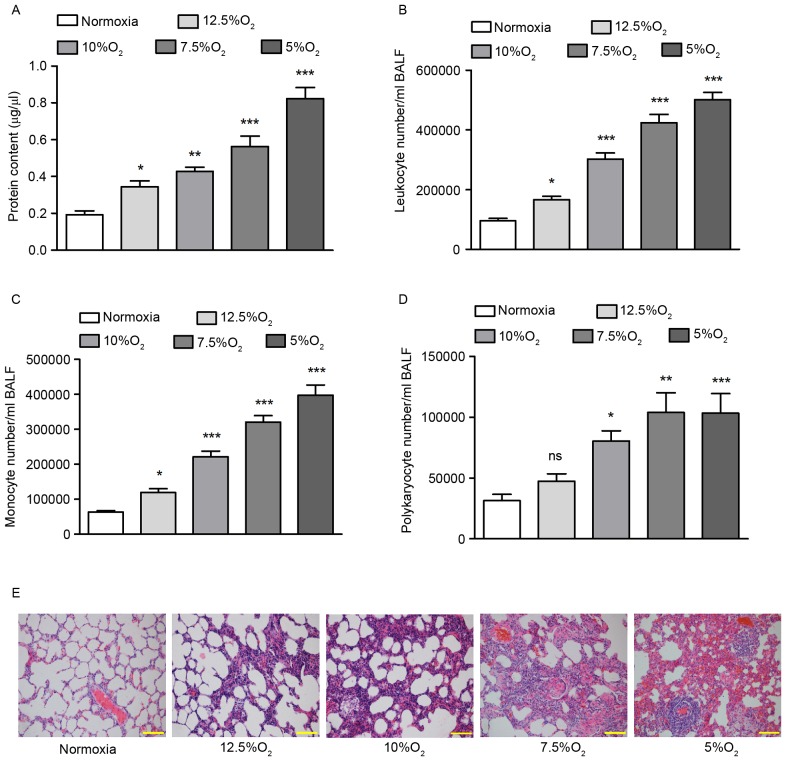
Figure 1.
Establishment of the rat obstructive sleep apnea model. (A) Protein content of BALF was detected by Bradford assay. (B) Leukocyte numbers in the BALF of rats at different concentrations of O2. (C) Monocyte numbers in the BALF of rats at different concentrations of O2. (D) Polykaryocyte numbers in the BALF of rats at different concentrations of O2. (E) Hematoxylin and eosin staining of rat pulmonary tissues from each group. Scale bar=100 µm. *P<0.05, **P<0.01, ***P<0.001 vs. normoxia. Ns, no significance; BALF, bronchoalveolar lavage fluid.

