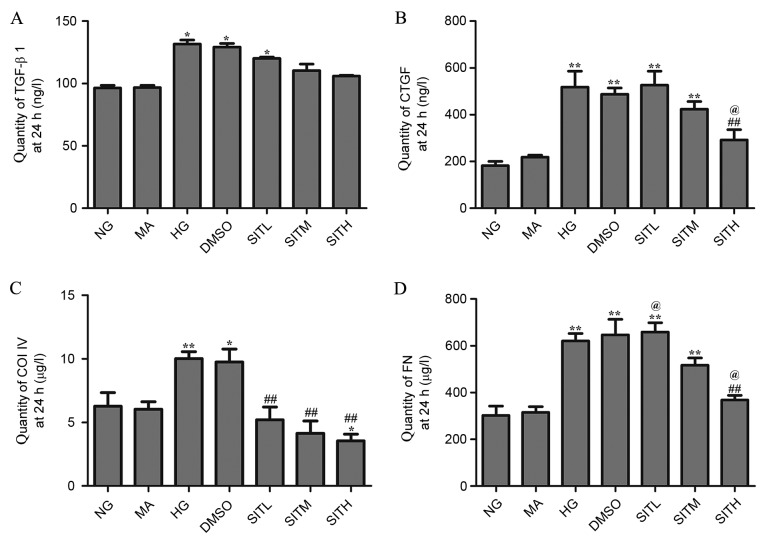
Figure 5.
Quantity of TGF-β1, CTGF, ColIV and FN proteins in the supernatant of sitagliptin-treated mesangial cells at 24 h. Quantity of (A) TGF-β1. (B) CTGF, (C) ColIV and (D) FN. Data are expressed as the mean ± standard error of the mean, n=3. *P<0.05 and **P<0.01 vs. the NG group; ##P<0.01 vs. the HG group; @P<0.05 vs. SITM. TGF-β1, transforming growth factor-β1; CTGF, connective tissue growth factor; ColIV, collagen type IV; FN, fibronectin; NG, normal glucose; MA, mannitol; HG, high glucose; DMSO, high glucose with 1% dimethyl sulfoxide; SITL, high glucose with 0.1 µmol/ml sitagliptin; SITM, high glucose with 1 µmol/ml sitagliptin; SITH, high glucose with 10 µmol/ml sitagliptin.

