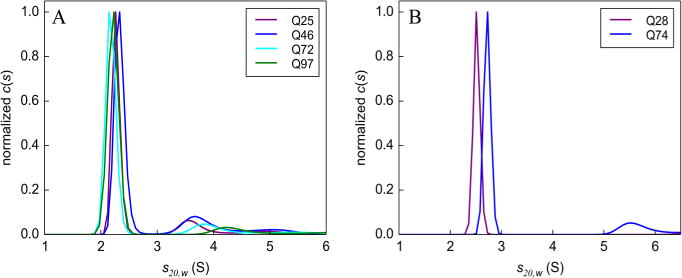
Figure 2.

Sedimentation velocity monomer analysis. c(s) sedimentation coefficient distributions in (A) D. melanogaster and (B) C. elegans showing a distinct peak corresponding to the main boundary component. Boundary data used for this analysis are shown in Figures S2 and S3. Data were collected at 50000 rpm.
