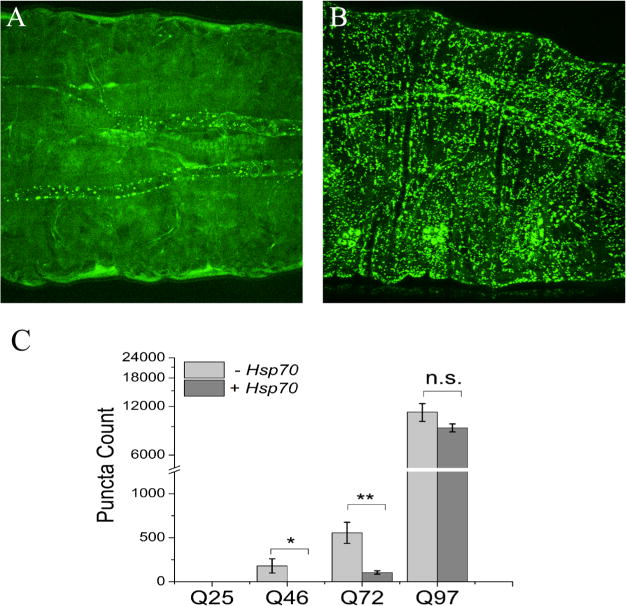
Figure 4.

Fluorescence images and analysis of D. melanogaster third-instar larvae. Images showing the expression of polyglutamine expansions in the midsection of third-instar larvae for (A) HttQ46-eGFP and (B) HttQ97-eGFP. (C) Quantitation of puncta in the entire larva with or without Hsp70 expression using the images shown in Figure S4. Image analysis for counts of puncta is described in Materials and Methods (see also Figure S12). The scale bar is 0.1 mm. Statistical analysis was performed using a one-way analysis of variance. *P < 0.05; **P < 0.01. n.s., not significant.
