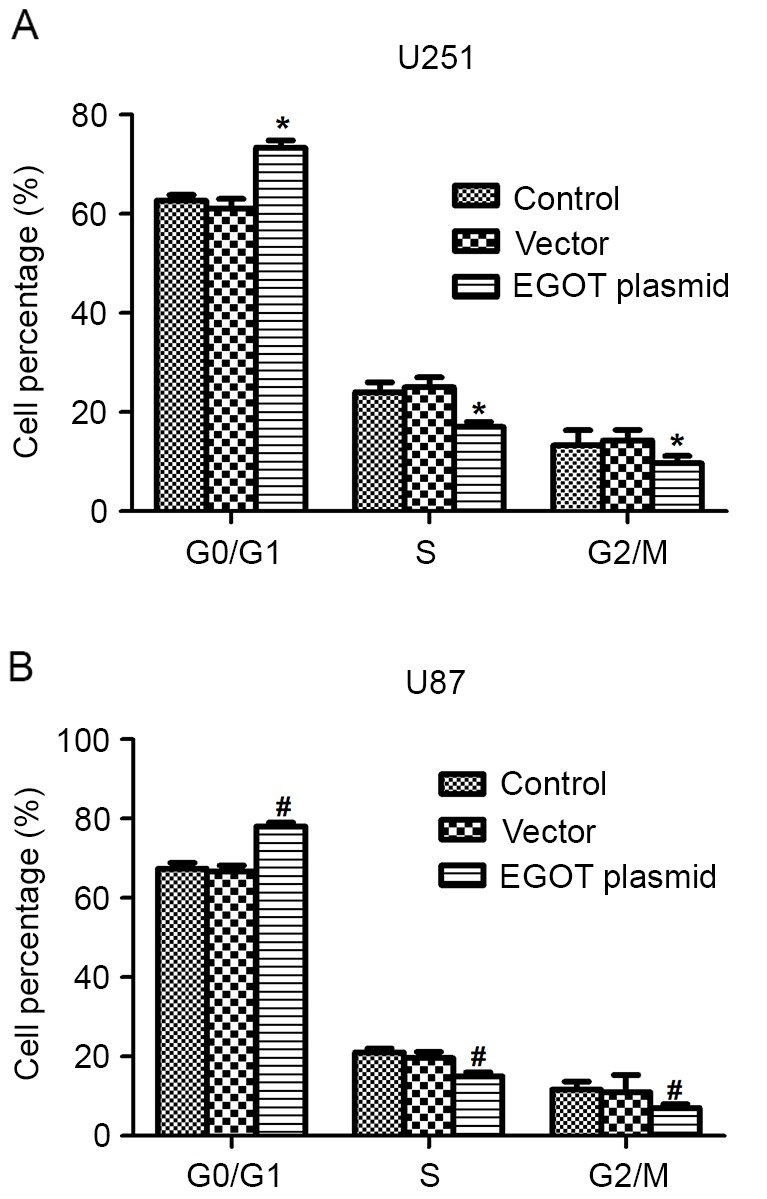
Figure 3.

Overexpression of EGOT arrests the cell cycle at G0/G1 phase. (A) In U251 cells, when cells were transfected with EGOT, the cell percentage increased by ~20% in the G0/G1 phase and decreased correspondingly in the S and G2/M phases. (B) U87 cells were also subjected to cell cycle analysis with or without EGOT overexpression. Cell percentages in each phase were indicated. All data are expressed as the mean ± standard deviation. *P<0.05 vs. matched control U251 cells; #P<0.05 vs. matched control U87 cells. EGOT, eosinophil granule ontogeny transcript.
