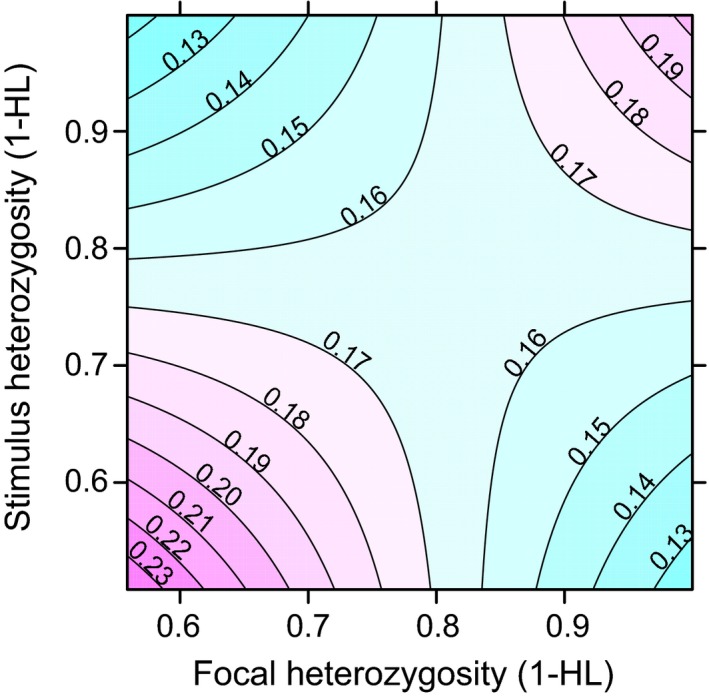
Figure 2.

Preferences for heterozygosity levels. Individuals spent more time with stimulus birds with similar heterozygosity levels. Association time with each stimulus bird was calculated as the fraction of the total time spent with all stimulus birds. Red colours indicate that relatively more time was spent and green colours indicate that relatively less time was spent.
