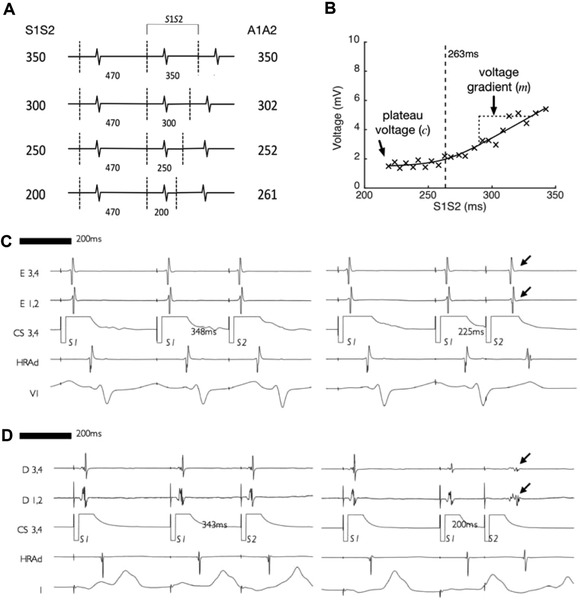
Figure 1.

Pacing protocol overview and example electrograms. A: pacing protocol consisting of a two‐beat 470 milliseconds drive train followed by a single premature extrastimulus reducing in 2% steps from 350 to 200 milliseconds or loss of atrial capture. B: bipolar voltage of atrial electrograms recorded at a single site. Bipolar voltage is seen to attenuate as extrastimulus coupling interval is reduced. A best‐fit curve consisting of a hyperbola with asymptotes at y = c and y = mx is fitted to the data, allowing the plateau voltage (c) and the gradient of the initial phase of voltage attenuation (m) to be determined. C: An example of a recording site where bipolar voltage attenuation with extrastimulus coupling interval was minimal (arrowed). D: An example of a recording site where bipolar voltage attenuation with extrastimulus coupling interval was more pronounced (arrowed)
