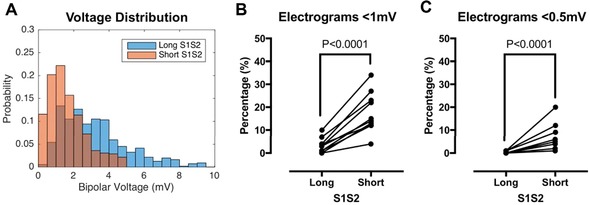
Figure 2.

Effect of bipolar voltage attenuation on left atrial voltage quantification. A: Bipolar voltage distribution for all recording sites is shown at long extrastimulus coupling interval (blue bars) and short extrastimulus coupling interval (orange bars), with overlap between the bars shown in brown. B: Sites with voltage <1 mV (low voltage) were significantly more frequent at short compared to long extrastimulus coupling interval. C: Sites with voltage <0.5 mV (very low voltage) were significantly more frequent at short compared to long extrastimulus coupling interval. No sites showed very low voltage at long extrastimulus coupling interval [Color figure can be viewed at wileyonlinelibrary.com]
