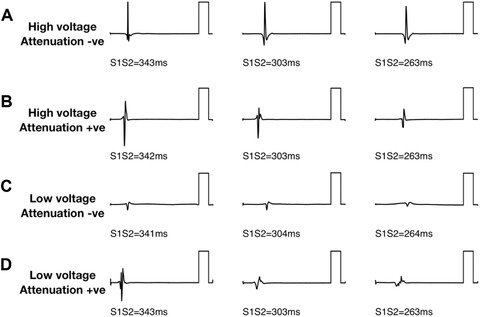
Figure 3.

Bipolar electrogram voltage patterns. Four patterns of electrogram voltage response to extrastimulus coupling interval were identified. Example electrograms are presented for each pattern. A: high electrogram voltage regardless of coupling interval (“high voltage, attenuation –ve”). B: Attenuation of electrogram voltage with shortening extrastimulus coupling interval to not less than 1 mV (“high voltage, attenuation +ve”). C: low electrogram voltage irrespective of coupling interval (“low voltage, attenuation –ve”). D: Attenuation of electrogram voltage with shortening extrastimulus coupling interval to less than 1 mV (“low voltage, attenuation +ve”). Reference bars are 5 mV
