
Figure 6.
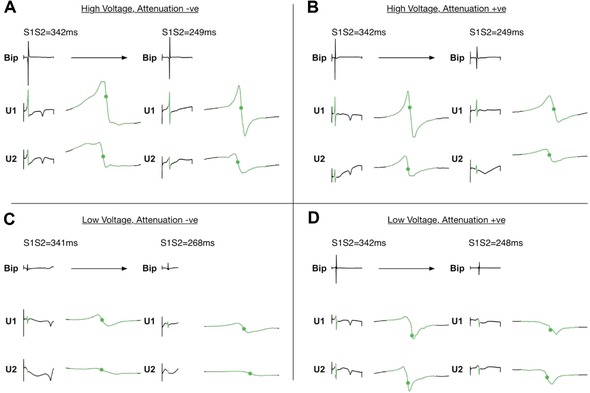
Unipolar electrogram patterns. Example unipolar electrograms recorded between the PentaRay and an IVC electrode are shown for each of the four identified bipolar voltage patterns. A: At high voltage, attenuation –ve sites there was minimal change in unipolar voltage and timing between long and short extrastimulus coupling interval. B: At high voltage, attenuation +ve sites corresponding attenuation of unipolar voltage and increase in unipolar delay (green dots) was seen. C: At low voltage, attenuation –ve sites unipolar voltage was again similar between long and short extrastimulus coupling interval. Note at this recording site there is also increased unipolar delay between U1 and U2 at short compared to long coupling interval. D: Low voltage, attenuation +ve sites were characterized by corresponding attenuation of unipolar electrogram voltage [Color figure can be viewed at wileyonlinelibrary.com]