
Figure 3.
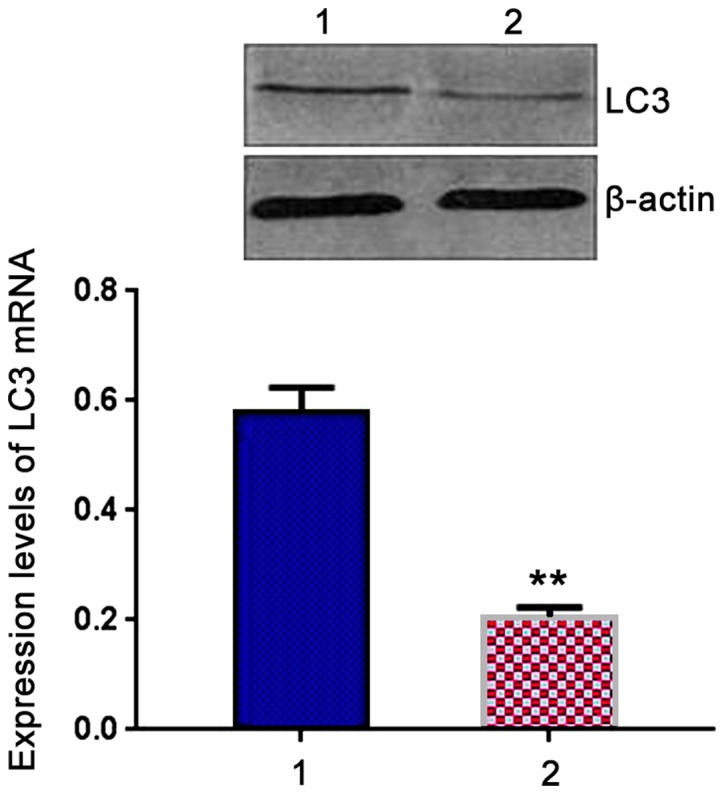
Comparison of expression levels of light chain 3 (LC3) mRNA in peripheral blood mononuclear cells (PBMCs) between two groups. Lane 1, Patient group; lane 2, control group. RT-PCR results showed that expression level of LC3 mRNA in patient group was significantly higher than that in control group. **P<0.05 compared with patient group.