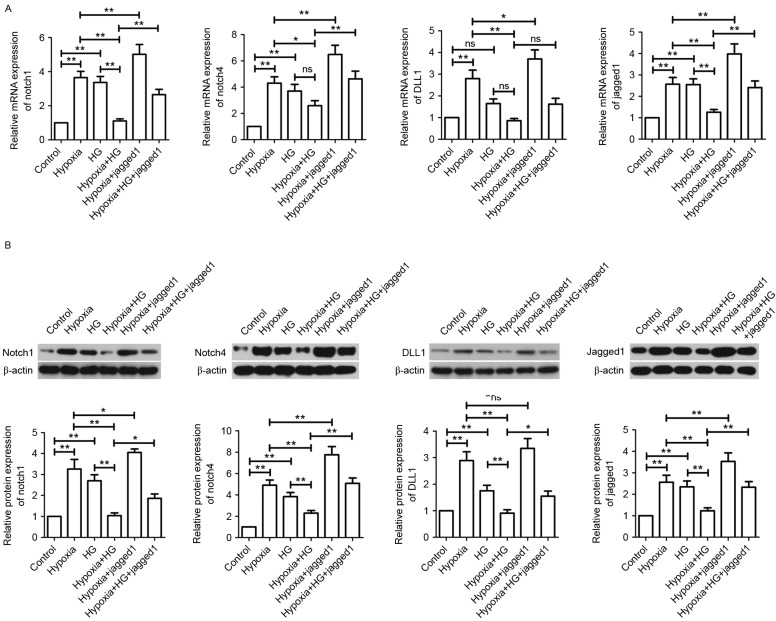
Figure 8.
Effect of Jagged1 on the Notch signaling pathway in vitro. (A) Gene expression levels of Notch1, Notch4, DLL1 and Jagged1 were measured by reverse transcription-quantitative polymerase chain reaction. Results were normalized to β-actin expression. (B) Protein expression levels of Notch1, Notch4, DLL1 and Jagged1 were measured by western blotting and normalized to β-actin. Data are expressed as the mean ± standard deviation. *P<0.05 and **P<0.01. HG, high glucose; DLL1, Delta-like 1; ns, not significant.

