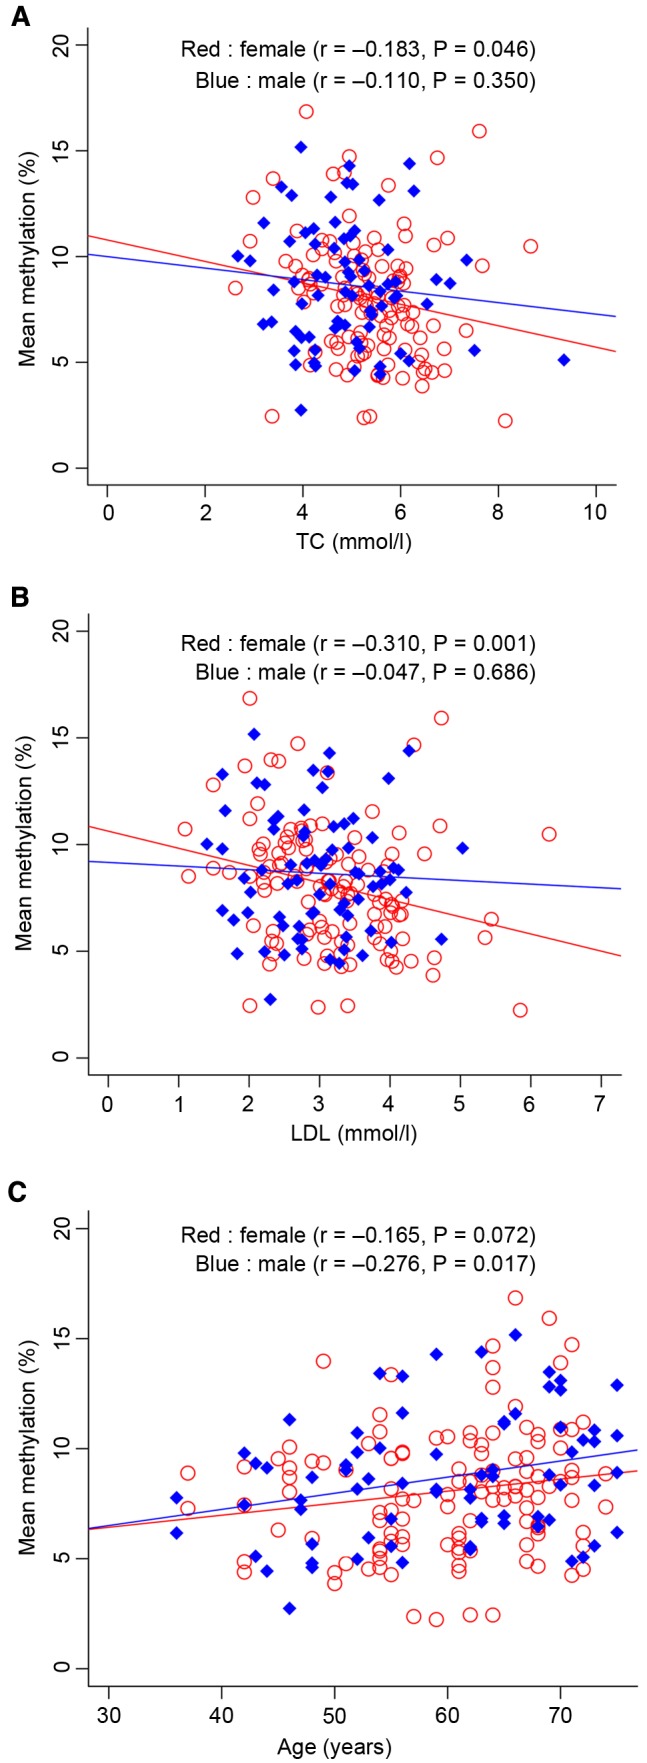
Figure 3.

Correlation analyses between the mean protein tyrosine phosphatase, non-receptor type 1 DNA methylation and clinical phenotypes. Correlation analyses between (A) the mean PTPN1 DNA methylation and TC level, and (B) the mean PTPN1 DNA methylation and LDL level. TC, total cholesterol; LDL, low-density lipoprotein.
