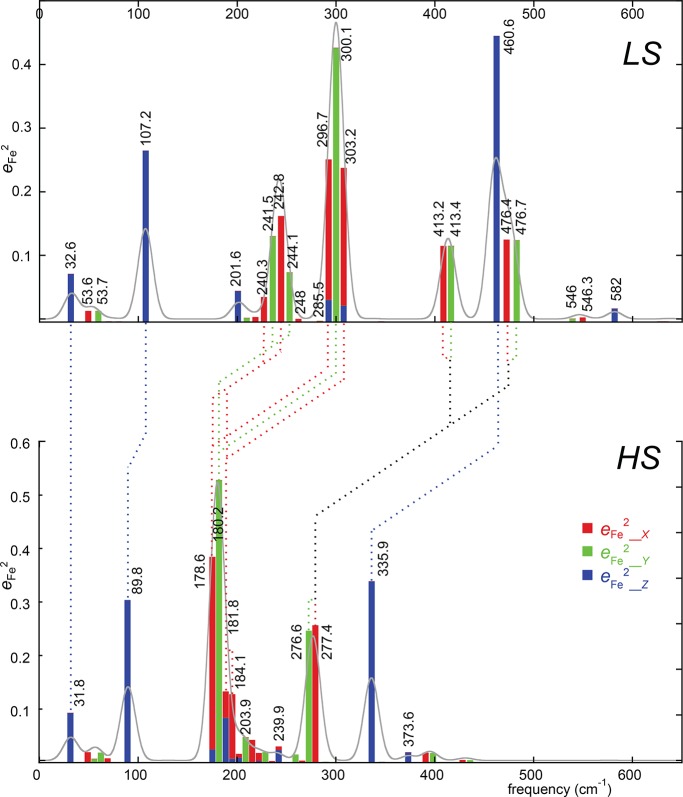
Figure 17.
Diagram illustrating the correlations of iron motion in the high- and low-spin states of [K(222)][Fe(TPP)(CN)]. Color coding is shown in the inset of the high-spin panel. Height of the bars gives the calculated kinetic energy contribution of iron to the mode. Horizontal axes are on the same linear scale; positions of the predicted peaks are somewhat arbitrary in order to avoid overlaps. Reprinted with permission from ref (127). Copyright 2012 American Chemical Society.

