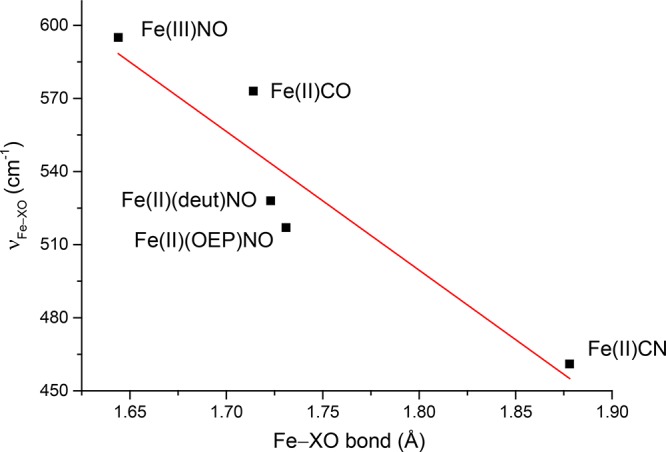
Figure 20.

Plot showing the correlation of the Fe–XO stretching frequencies determined by NRVS (highest frequency chosen when two are observed) with the observed (X-ray) Fe–X bond lengths for the five-coordinate Fe(XO) derivatives.. Correlation coefficient for the fit is 0.93.
