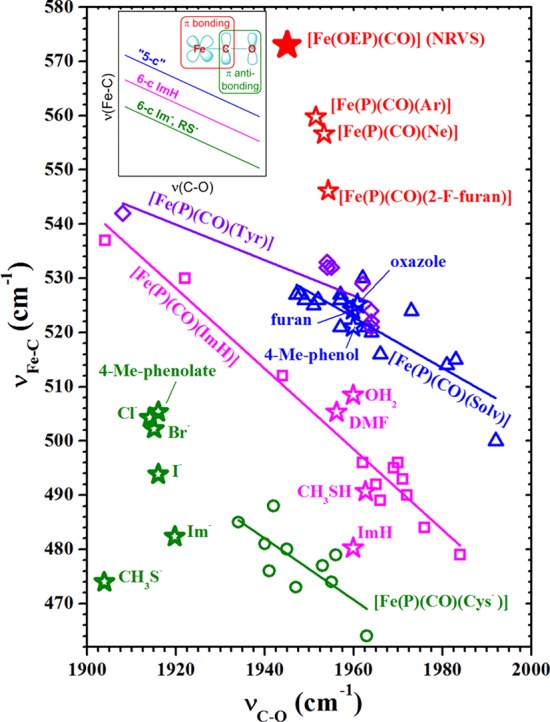
Figure 9.

Backbonding correlation plot showing the vibrational signature of [Fe(OEP)(CO)] (solid red star), with its uniquely high experimental νFe–C frequency. Open round (green, anionic), square (magenta, neutral), and triangular (blue, trans-O-bound) points were taken from ref (82) and represent various porphyrins and proteins. Diamond (violet, trans-Tyr) points are Tyr-liganded proteins.45,85 Inset in the upper left shows the correlation lines based on experimental data. “5-c” line is expected for six-coordinate species with trans H2O ligands (see ref (79)). Open star-shaped points give predicted (DFT) νFe–C and νC–O frequencies for the indicated trans ligand.79 Frequencies were scaled to those of [Fe(OEP)(CO)]. Reprinted with permission from ref (79). Copyright 2014 American Chemical Society.
