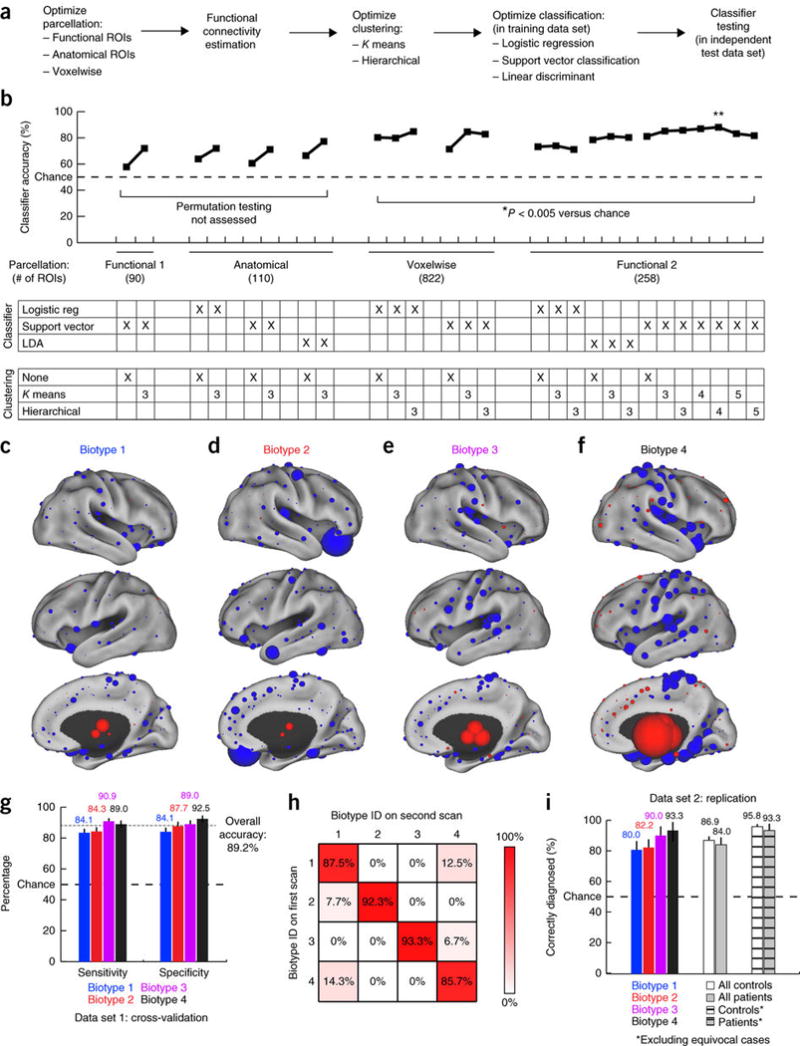
Figure 3. Functional connectivity biomarkers for diagnosing neurophysiological biotypes of depression.

(a) Data analysis schematic and workflow (Online Methods for additional details). (b) Optimization of diagnostic-classifier performance (accuracy) across the indicated combinations of methods for parcellation, clustering and classification. *P < 0.005, as estimated by permutation testing (Online Methods). Double asterisk (**) indicate the best performing protocol for parcellation, clustering and classification, and the focus of all subsequent analyses. (c–f) The neuroanatomical locations of the nodes with the most discriminating connectivity features are illustrated for each biotype for the four-cluster solution denoted by the double asterisk in b, colored and scaled by summing the results of Wilcoxon rank–sum tests of patients as compared to controls across all connectivity features associated with that node. Red represents increased and blue decreased functional connectivity in depression. (g) Sensitivity and specificity by biotype for the most successful classifiers identified in b (**). Error bars depict 95% confidence interval for the mean accuracy across all iterations of leave-one-out cross-validation. (h) Reproducibility of cluster assignments in a second fMRI scan (n = 50) obtained 4–5 weeks after the initial scan (χ2 = 112.7, P < 0.00001). (i) Classifier performance in an independent, out-of-sample replication data set (n = 125 patients, 352 healthy controls). Cross-hatched bars depict classifier accuracy with more stringent data quality controls (Online Methods) and excluding equivocal classification outcomes (the 10% of subjects with the lowest absolute SVM classification scores). Error bars depict 95% confidence intervals.
