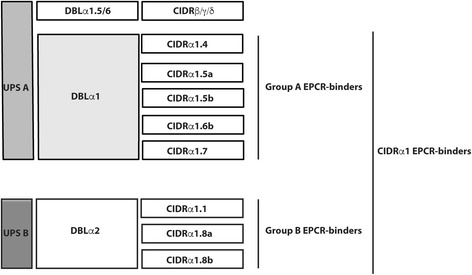
Fig. 1.

Schematics of the extracellular PfEMP1 domains, whose transcript levels are quantified in the study, and their known binding phenotype. CIDRα1-EPCR transcripts are estimated as the sum of [CIDRa1.1-CIDRa1.8b]Tu-7; group A-EPCR transcripts are estimated as the sum of [CIDRa1.4, CIDRa1.5a, CIDRa1.5b, CIDRa1.6b, and CIDRa1.7]Tu-4; group B-EPCR transcript levels are estimated as the sum of [CIDRa1.1, CIDRa1.8a, and CIDRa1.8b]Tu-2. Tu are transcript units
