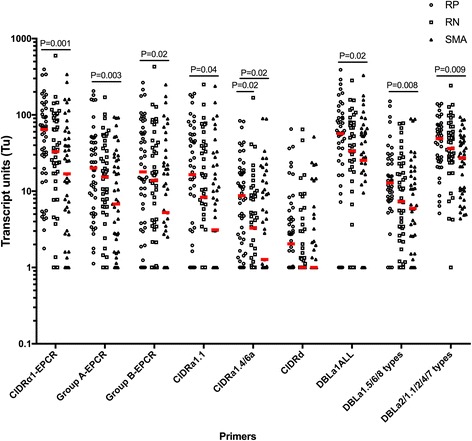
Fig. 3.

PfEMP1 transcript levels in retinopathy negative CM are intermediate between retinopathy positive CM and SMA, with only CIDRa1.4/6a being higher in retinopathy positive as compared to retinopathy negative CM. Transcript units for CIDRα1-EPCR (sum of [CIDRa1.1-CIDRa1.8b]Tu-7), group A-EPCR (sum of [CIDRa1.4, CIDRa1.5a, CIDRa1.5b, CIDRa1.6b, and CIDRa1.7]Tu-4), group B-EPCR (sum of [CIDRa1.1, CIDRa1.8a, and CIDRa1.8b]Tu-2), CIDRα1.1, CIDRa1.4/6a, DBLa1ALL (all group A PfEMP1), DBLa1.5/6/8 types (group A PfEMP1 typically non-EPCR-binding), CIDRd (group A PfEMP1, non-EPCR-binding), and DBLa2/1.1/2/4/7 (group A PfEMP1, typically EPCR-binding). Transcript units of expression are shown on a logarithmic scale. The horizontal lines in red represent median values. P values are estimated by analysis of variance (ANOVA) on log10 transformed arbitrary units followed by Tukey adjustment for multiple comparisons. Retinopathy positive CM (RP CM, n = 50), retinopathy negative CM (RN CM, n = 47), severe malarial anemia (SMA, n = 47)
