Fig. 2.

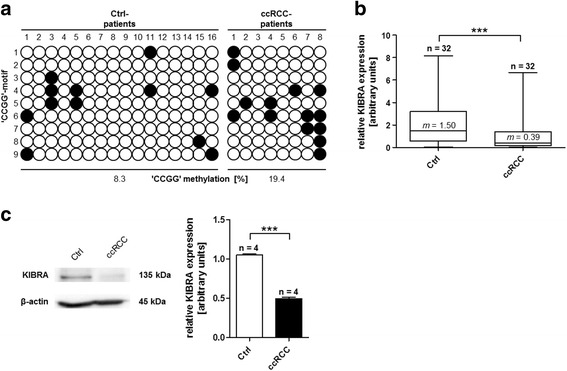
KIBRA “CCGG” methylation within CpG I in ccRCC samples. a Methylation patterns of “CCGG”-motifs within CpG I in control (Ctrl) and ccRCC samples. Each line represents one “CCGG”-motif within CpG I. Filled circles indicate methylated, open circles indicate unmethylated “CCGG”-motifs. Differences of methylation between the control (12/144 [8.3%]) and ccRCC (14/72 [19.4%]) group were significant (p = 0.039). Analysis revealed significantly decreased mRNA KIBRA expression levels for ccRCC samples in b real-time PCR and c western blot analyses. ***p < 0.001; m median
