
Extended Data Figure 10. Design and validation of FISH probes for quantification of compartments.
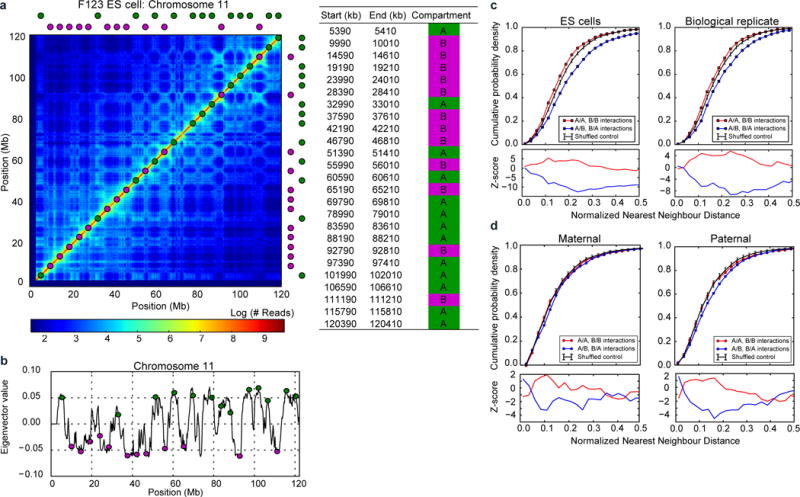
a, FISH probe design for quantifying compartment segregation; left: exact locations of designed probes, right: probe locations are shown superimposed on the Hi-C data (200 kb resolution) from F123 ES cells30 b, probe locations shown relative to the profile of compartment strength (200 kb resolution) as measured by the first eigenvector of the Hi-C map’s eigenvector decomposition. c–d, top: nearest neighbour FISH distances - the same as curves in Figure 4d, but shown for (c) ES cells (n(replicate1)=87, n(replicate2)=78) and (d) maternal (n=33) and paternal (n=37) zygotic nuclei; bottom: z-scores showing the number of standard deviations from the expected minimum distance distribution of the control data; the control distribution was obtained from randomly reshuffling probe colours as described in the methods.