
Figure 3. Chromatin reorganization during oocyte maturation.
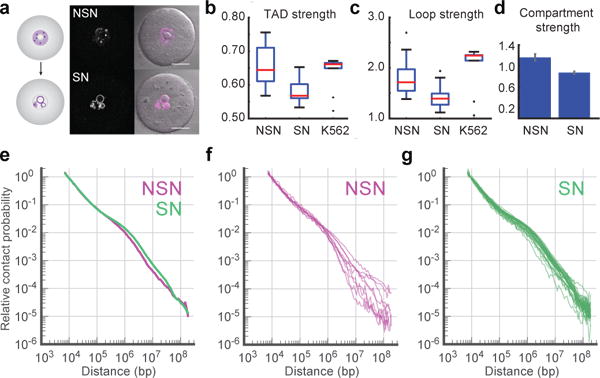
a, Immature (Non-Surrounded Nucleolus, NSN) and mature (Surrounded Nucleolus, SN) oocytes stained with Hoechst (magenta). Scale bar, 25 μm. Images were adjusted in brightness/contrast settings in the individual channels using ImageJ. b–d, Comparison of average TAD strength (b), loop strength (c) and compartment strength (d) in NSN and SN oocytes with Hoechst staining (n(NSN)=15, n(SN)=30). Error bars in (d) show standard deviation, obtained by bootstrapping. e, Pc(s) in data from combined NSN and SN oocytes, scored by Hoechst staining. f–g, Pc(s) in single Hoechst-stained NSN (f, n=9) and SN oocytes (g, n=27) with >30K total contacts.