
Figure 2. Analysis of TRF2-NBS1 interaction.
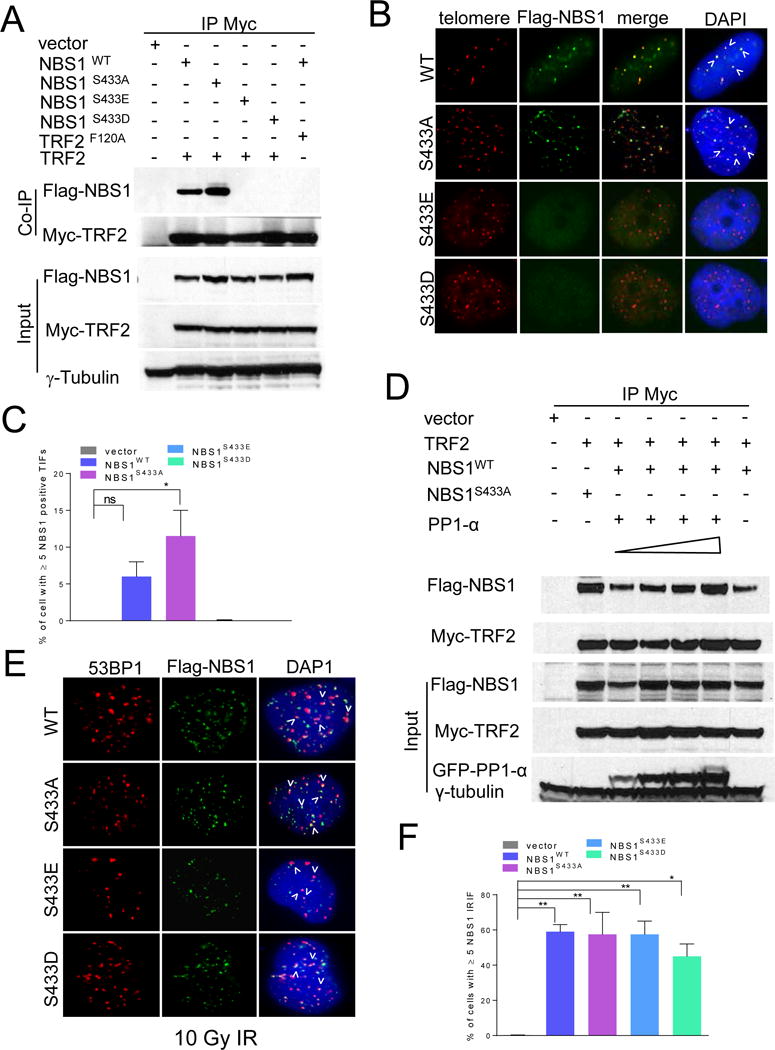
A. 293T cells expressing the indicated proteins were immunoprecipitated with anti-Myc antibody and immunoblotted with anti-Myc and anti-Flag antibodies. Inputs represent 5% of the total cell lysate used for the immunoprecipitations. γ-tubulin: loading control. B. Localization of WT mNBS1 and mNBS1S433 mutants in Nbs1−/− MEFs. Telomeres were visualized with telomere PNA-FISH (red), anti-Flag antibody to visualize mNBS1 (green) and DAPI staining to visualize nuclei (blue). C. Quantification of co-localization of WT mNBS1 and mNBS1S433 mutants on telomeres in (B). Data represents the mean of three independent experiments ± standard error of the mean (SEM). *: p<0.0184, one-way ANOVA. NS, not significant. D. 293T cells expressing the indicated proteins were immunoprecipitated with anti-Myc antibody and immunoblotted with anti-Myc, anti-Flag and anti-GFP antibodies. Increasing concentration of PP1-α (0.125μg to 1.0 μg) were used in the lanes 3–6. Inputs represent 5% of the total cell lysate used for the immunoprecipitations. γ-tubulin: loading control. E. 10Gy IR induced foci with transiently expressed WT mNBS1 and mNBS1S433 mutants in U2OS cells. Cells were stained with anti-53BP1 antibody (red), anti-Flag antibody to visualize NBS1 (green) and DAPI to visualize nuclei (blue). F. Quantification of WT mNBS1 and mNBS1S433 mutant foci in (E). Data represents the mean of three independent experiments ± SEM; n>100 nuclei scored per experiment (*: p<0.02; **: p<0.008; one-way ANOVA). See also Figures S2.