
Fig. 1. The L530R variation abolishes the Ca2+ uptake activity of TRPV5.
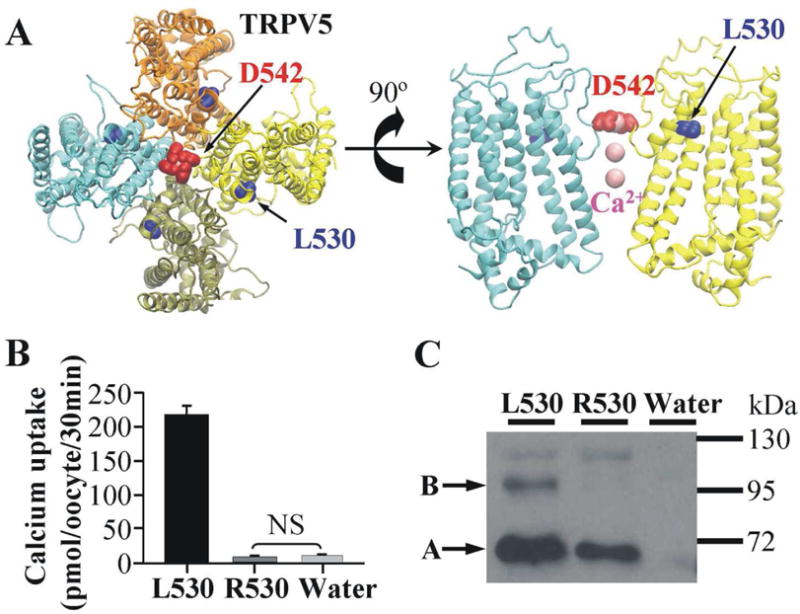
(A) The location of L530 in the modeled structure of the TRPV5 tetramer. The top view of the TRPV5 tetramer is shown on the left and only two monomers are shown in the side view (right panel) for clarity. The four monomers are shown in cyan, tan, yellow and orange, respectively. D542 in the Ca2+ selective filter, L530 where variation occurred, and Ca2+ ions are shown in red, blue and pink, respectively. (B) Ca2+ uptake in Xenopus oocytes expressing TRPV5 with L530, R530, or in control oocytes. Each group contained Ca2+ uptake values of 18 Xenopus oocytes from two frogs. NS means the difference is not significant. (C) Western blot analysis of TRPV5 variants (L530 and R530) expressed in Xenopus oocytes. Band B represents complex-glycosylated form of TRPV5, and band A represents core-glycosylated form.