
Fig. 4. The L530R variation causes a shift of the pore helix and residue D542 towards the membrane surface.
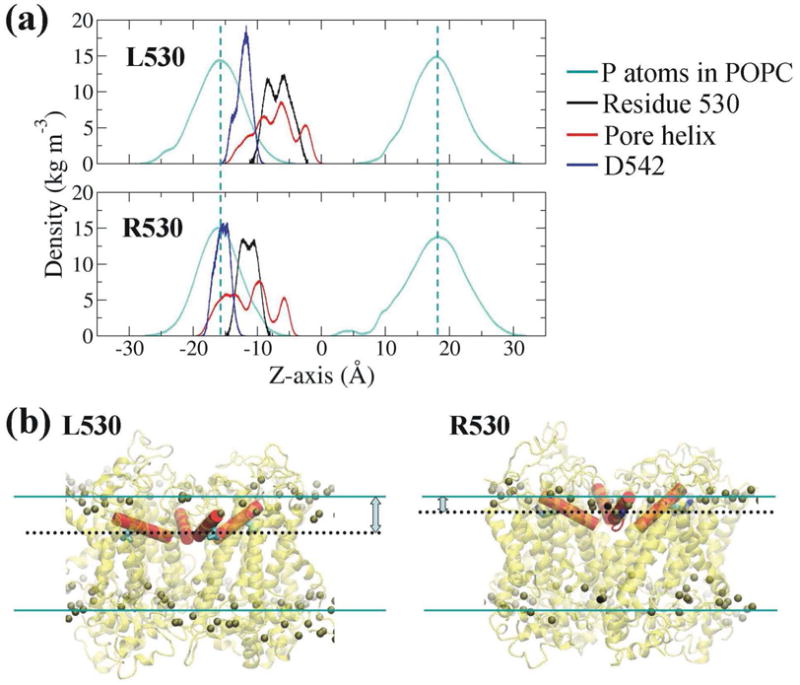
(A) Comparison of the mass density of residue 530, pore helix and residue D542 between L530 and R530 systems. The dashed cyan lines indicate the density peaks of the P atoms of POPC lipids. Note the density values of P atoms of POPC and pore helix are reduced 40 times and 10 times, respectively, in order to be shown in the same scale. (B) Final structures showing the position of residue 530 (black dotted lines) and pore helix (in red) relative to membrane surface (cyan lines). The P atoms of POPC are shown as balls.