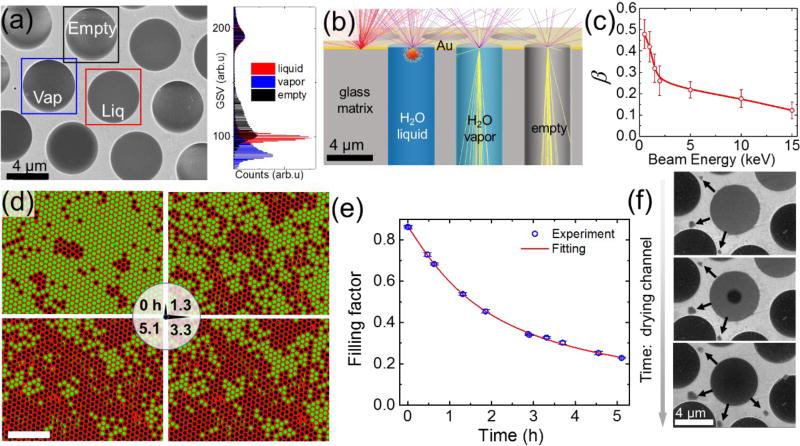
Figure 2.
(a) SEM image (Ebeam=10 keV) of empty, water-filled and vapor-filled MCA channels, all sealed with bilayer graphene. Bright (framed with black square), uniformly gray (framed with blue square), and uniformly dark (framed with red square) channels correspond to empty, water and vapor filled channels, respectively; The color-coded histogram on the right shows the distinctly different distributions of the gray scale values (GSV) inside the corresponding square frames. (b) Monte-Carlo trajectories simulations of 8 keV electron beam interacting with an empty (vacuum-filled) channel, a water-vapor-filled channel (assuming 3.17 kPa water saturated vapor pressure at 25°C), a liquid-water-filled channel, and the gold MCA surface. The number of BSEs is proportional to the density and Z-number of the sample, and varies inversely with the probing depth. (c) The H2O to Au signal ratio of scattered electrons vs. electron beam energy. Error bars show the standard deviation of gray scale values obtained from more than 5 different SEM images recorded under the same beam energy (d) SEM images of the MCA (contrast and coloration were adjusted to highlight water filled versus empty or vapor-filled channels), showing a decrease in the number of channels filled with liquid over time (vacuum ≈ 10−4 Pa). Bright circles correspond to microchannels filled with water, whereas dark circles are empty ones. The scale bar corresponds to 50 µm (e) Experimentally recorded time evolution of the filling factor, i.e. the ratio of filled channels to all channels (blue circles). The data were obtained from consecutive SEM images of the same FOV (2.5 × 104 µm2 corresponding to ≈ 900 micro-channels). The beam was blanked between the measurements to avoid radiolytic bubble formation inside the channels. Error bars are due to uncertainty in the filling status of the channels at the very perimeter of the FOV. The red curve depicts data fitting based on a normal distribution of defects across channels. (f) The sequence of SEM (Ebeam=2 keV) images showing the typical steps of the channel drying process: water filled (top panel), bubble (middle panel) and vapor containing (bottom panel) channel. The arrows indicate the transport of water under the graphene towards few newly formed water blisters (dark)

