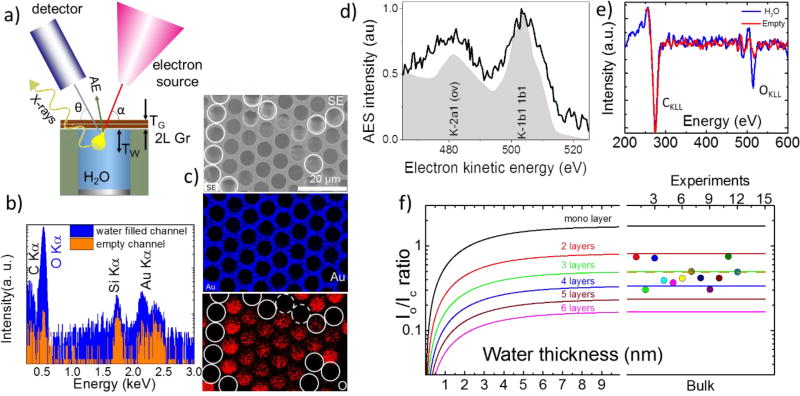
Figure 3.
Electron spectroscopies in a liquid-filled MCA. (a) The experimental setup for spectroscopic (EDS and AES) data collection. The yellow bulb defines the electron interaction volume. (b) EDS spectra (log scale) recorded in water filled (blue) and empty (red) channel acquired through a double layer graphene membrane. The difference in the O Kα peak intensity is due to the presence of liquid water inside the channel. The Si Kα and Au Kα peaks originate from the Au coated MCA matrix, which is made of silica; (c) An SEM image (top) and EDS maps of an MCA with water, depicting Au and O element distribution. The white circles depict the empty channels, while dashed ones denote the channels where water evaporated during map acquisition; (d) AES OKLL spectra exhibiting characteristic K-VV transitions typical for liquid water. For comparison, off-resonance AES of water jet excited with synchrotron soft X-rays from ref.26 is shown in a gray color. (e) Differential AES spectra recorded from two adjacent water filled (blue curve) and empty (red curve) MCA channels. (f) The calculated dependence of OKLL to CKLL peak intensities ratio as a function of the thickness of water under the graphene and a number of the graphene layers. The right panel shows experimental I0/IC data recorded from ten water filled channels capped with a bilayer graphene. The measured average ratio (dotted line) corresponds to an effective membrane thickness to be approximately 3 graphene layers

