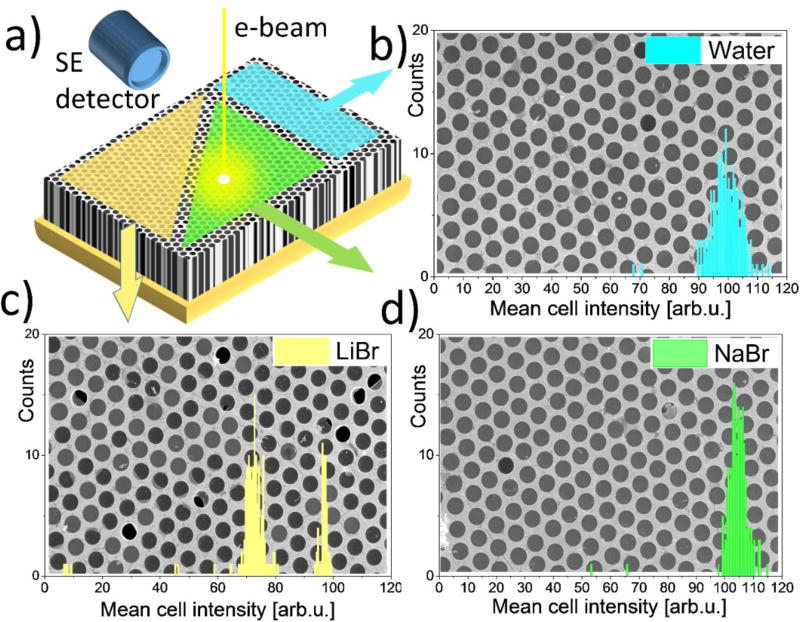
Figure 7.
An example of combinatorial SEM imaging (Ebeam = 5 keV) using MCA platform. Three section of the bilayer graphene MCA sample were filled with water and ca. 1 mol/L solutions of LiBr and NaBr and imaged with E–T detector under the same contrast brightness settings. (a) a schematic of the MCA sample with colored regions filled with different electrolytes. (b)–(d) SEM images and cell histograms of each region. Histograms show distribution of number of cells with a given mean cell signal intensity. Note, that the gold-coated matrix GSV of the images were excluded from analysis and are not reflected in the histograms.

