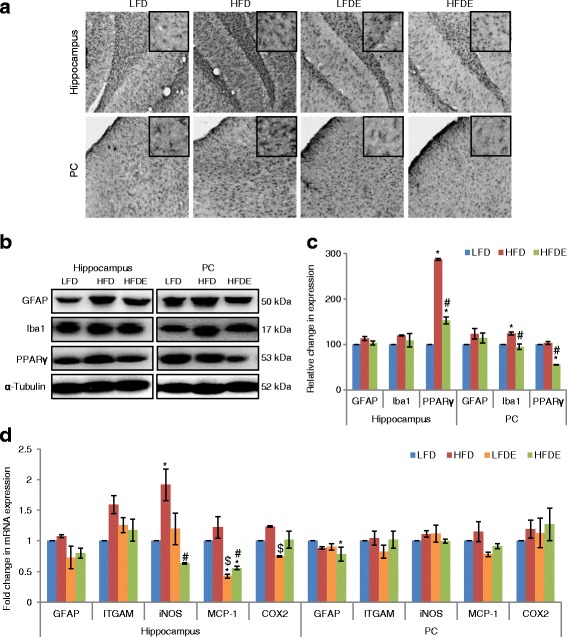
Fig. 2.

ASH suppressed inflammation at both transcriptional and translational levels. a Immunostaining of GFAP in the hippocampus and PC regions of LFD, HFD, LFDE, and HFDE rats (n = 3 each group). Insets show high magnification images of GFAP staining. Upregulation of GFAP in HFD rats was seen, which was ameliorated in HFDE rats. b, c Representative Western blot analysis for GFAP, Iba1, and PPARγ in the hippocampus and PC regions of LFD, HFD, and HFDE animals. Histograms represent percent change in intensity taking value in LFD rats as 100%. d Histograms representing fold change in mRNA expression of GFAP, ITGAM, iNOS, MCP-1, and COX2 in the hippocampus and PC regions of rat brain among the four groups of animals (n = 3–4 each group). Values are expressed as mean ± SEM. * p ≤ 0.05 LFD versus HFD, LFDE, and HFDE rats, # p ≤ 0.05 HFD versus HFDE rats, $ p ≤ 0.05 HFD versus LFDE rats, Holm–Sidak method after one-way ANOVA
