
Fig. 6.
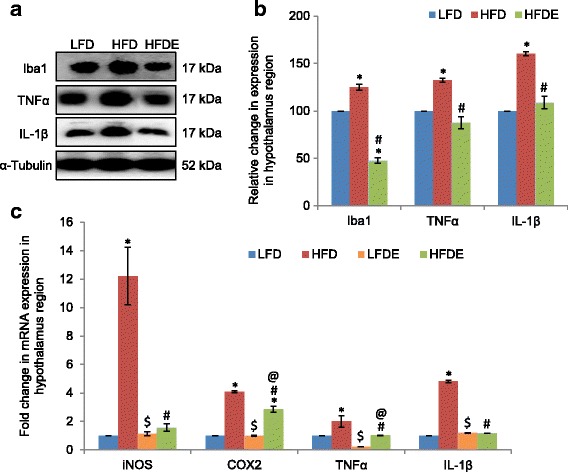
ASH suppressed inflammation caused by DIO in the hypothalamus. a, b Representative Western blot analysis for Iba1, TNFα, and IL-1β in the hypothalamus region of LFD, HFD, and HFDE animals. Histograms represent percent change in intensity taking value in LFD rats as 100%. c Histograms representing fold change in mRNA expression of iNOS, COX2, TNFα, and IL-1β in the hypothalamus region of rat brain among the four groups of animals (n = 3–4 each group). Values are expressed as mean ± SEM. * p ≤ 0.05 LFD versus HFD, LFDE, and HFDE rats, # p ≤ 0.05 HFD versus HFDE rats, $ p ≤ 0.05 HFD versus LFDE rats, @ p ≤ 0.05 LFDE versus HFDE rats, Holm–Sidak method after one-way ANOVA