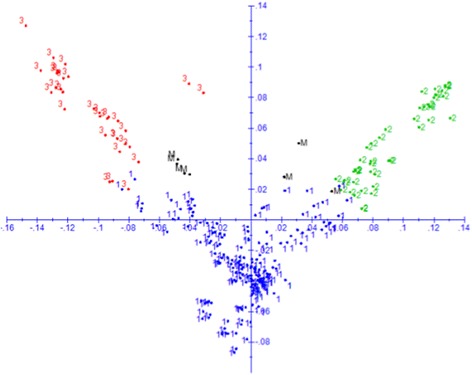
Fig. 3.

Plot of PC1 (7.1%) and PC2 (4.5%) from principal coordinate (PC) analysis of 265 inbred lines based on genetic distance matrix calculated from 220,878 SNPs. The plot was made using predicted group membership from STRUCTURE (group 1 = blue; group 2 = green; group 3 = red; mixed group = M, black). See Additional file 1 for details on membership of each group
