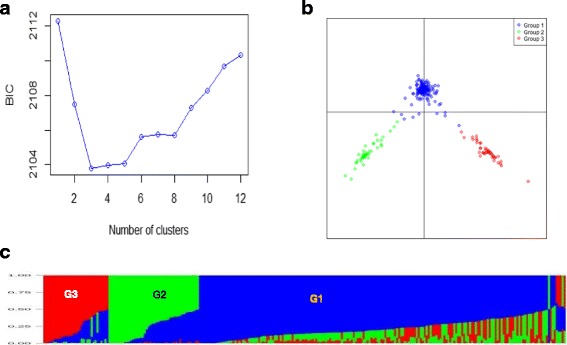
Fig. 4.

Population structure of 265 inbred lines based on 21,645 SNPs using Discriminant Analysis of Principal Components (DAPC) and the model-based STRUCTURE: a Bayesian Information Criterion (BIC) values showing number of possible clusters ranging from 1 to 12; b Plot of PC1 and PC2 from DAPC showing the three groups; (c) groups predicted based on STRUCTURE at K = 3 (group 1 = G1; group 2 = G2, and group 3 = G3). In STRUCTURE, each inbred line is represented by a thin vertical bar, which is partitioned into three colored segments (blue = G1, green = G2 and red = G3) on the x-axis, with lengths proportional to the estimated probability membership on the y-axis
