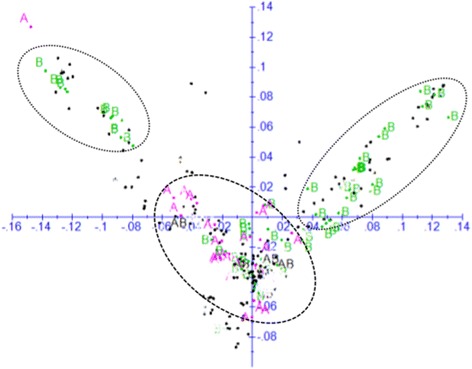
Fig. 5.

Plot of PC1 (7.1%) and PC2 (4.5%) from principal coordinate (PC) analysis based on genetic distance matrix calculated from 220,878 SNPs. Only inbred lines that belongs to heterotic group A and B are shown in pink and green font, respectively. Note that inbred lines in heterotic group B are primarily divided in two subgroups, while those in heterotic group A belong to a single group (see Additional file 1 for details)
