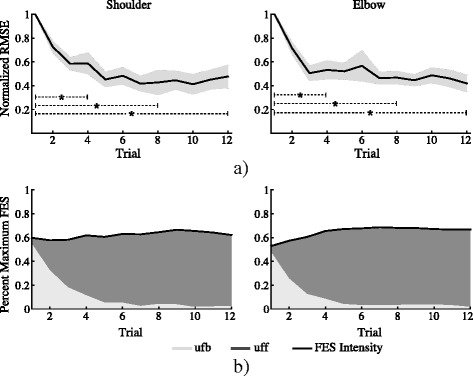
Fig. 5.

a Mean values of the normalized root mean squared error (RMSE, black line) and its standard error (gray shaded areas) across healthy subjects, corresponding to the shoulder (left) and elbow (right) joints. Dotted lines denote significance difference between trials. b Mean values of provided FES intensity, represented as a percent of the maximum stimulation intensity, across subjects. Light gray and dark gray areas depict the contribution of the feedforward (ufb) and feedback (uff) loop to the total FES intensity, measured with the power ratio (PR)
