Fig. 8.

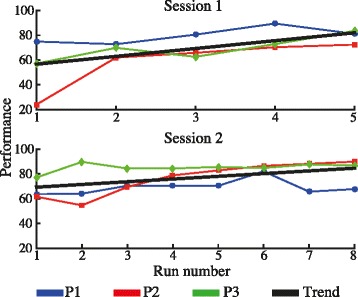
Averaged tracking performance for each run corresponding to session one and two. The black lines represent the linear fitting regression across subjects

Averaged tracking performance for each run corresponding to session one and two. The black lines represent the linear fitting regression across subjects