
Fig. 2.
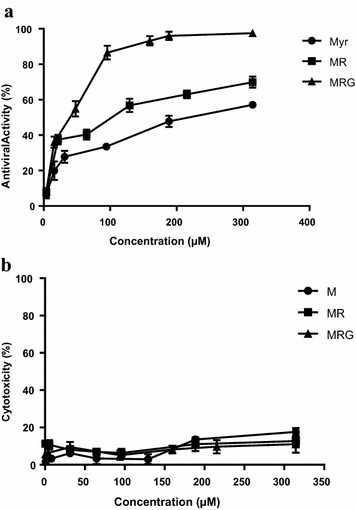
Antiviral a and cytotoxic b activity of compounds evaluated. The percent of cytotoxicity of different concentrations of MR (Square), MRG (Triangle) and M (Circle) are shown as media ± SEM. Antiviral activity (solid lines) is expressed as the percent inhibition of p24 production relative to control. Results are media ± SEM (n = 3)