
Fig. 1.
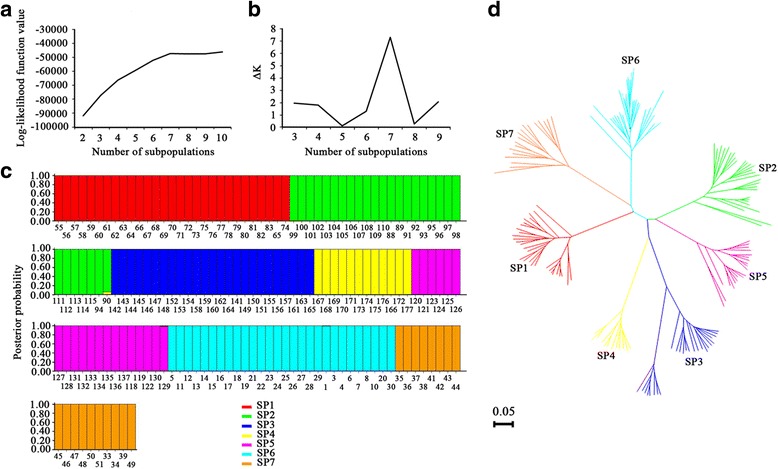
Population genetic architecture analysis of 160 varieties. Effects of changes in the log-likelihood function value (a) and the ΔK value (b) on the number of subpopulations, posterior probabilities of 160 varieties belonging to seven subpopulations (c) and the neighbour-joining tree for 160 varieties based on Nei’s genetic distance (d). Each variety is represented by a vertical bar. The coloured subsections within each vertical bar indicate the membership coefficients (Q) of that variety in different subpopulations. The identified subpopulations are SP1 (red), SP2 (green), SP3 (navy blue), SP4 (yellow), SP5 (purple), SP6 (light blue), and SP7 (brown)